

The Hammer is a Japanese Candlestick that often forms in bullish reversal price patterns. It is a single candlestick that resembles a hammer.
It has a long bottom wick, also called the lower shadow, and a small body at the top.
The perfect hammer candle has no upper wick above its body. However, some traders will also call a hammer a candlestick with a very short upper wick at the top of its body.
The Hammer candlestick anatomy
Here is a graphic representation of the Hammer price action anatomy.
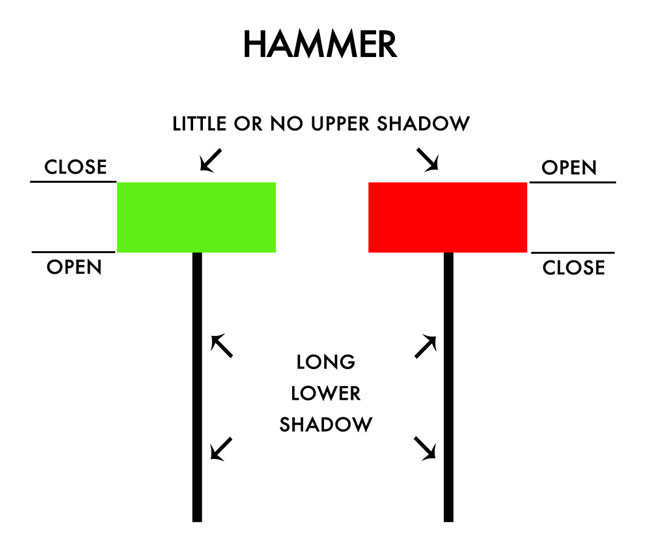
To get even more technical on what really forms a hammer price pattern, we have to look at the length of the lower wick, the long lower shadow. Basically, the lower wick needs to be at least two times longer than the body of the candlestick.
In addition, according to professional traders, the body of a valid and tradable hammer candle must form at the end of the trading range and the next candle needs to close higher. Only then, the hammer can be perceived as a bullish reversal signal.
Understanding the dynamics of the hammer candle
During a downtrend at the end of the trading range, a hammer price pattern represents pressure from buyers and it could be perceived as a bullish reversal of price action.
The long wick, the shadow, represents sellers who were in control and tried to push the price lower. But at a specific price level, the buyers entered the market more aggressively than sellers and pushed the price higher before the candle closed.
A ‘green’ hammer candle, where the price closed higher than when it opened, will be indicative of a stronger buying pressure. It might also suggest a more aggressive continuation of the bullish sentiment.
An elaborate study done on 20.000 hammer patterns confirmed that there is a slight advantage of bullish hammers, those that closed higher than the opening price.
Trading the hammer candlestick pattern

When the hammer candlestick pattern appears at the end of a trading range, traders take notice of possible bullish reversal. Yet entering before the hammer candle closes completely, can be risky.
Most price action traders will wait to see if the next candle pattern opens higher than the hammer candlestick. Some will wait patiently until the next candle closes higher for a more assured confirmation.
The main reason for this is to confirm that buyers are really in control and whether this sentiment continues in the next candle patterns.
For additional support of the hammer price action signal, traders like to confirm the buyer’s pressure with Volume levels.
Placing stop losses using the Hammer pattern
When trading the hammer price action pattern, one could place a stop loss right below the lower wick, as seen in the image below.

A tighter, but riskier stop loss would be just below the body of the hammer candlestick. In the example chart above, a tighter stop loss positioned right after the body of the candle would have been executed and unfortunately result in a loss.
Placing the stop loss below the wick of the Hammer candle would be well advised.
MT4 indicator for Hammer candlestick detection
This price action indicator will detect and signal various candlestick patterns, including the hammer candlestick, hanging man, pin bar, doji, and shooting star. These patterns will be detected automatically on added trend lines or support and resistance levels.
This indicator also uses unique signalling algorithm. It is based on the above mentioned candle patterns and the patterns that follow after. This is important in confirming the price reversal of the hammer candle, as well as the other candles.