

Here is a quick MetaTrader 4 snapshot of Bitcoin BTCUSD Weekly Chart taken on February 27th 2020.
The indicator’s settings are MA 5 and MA 21 with ADX of 25. The Upper Time frame confirmation filter is switched off.
The indicator shows three signals, but the most important one, on this particular chart is the valid signal that marked a price movement of 500 pips.
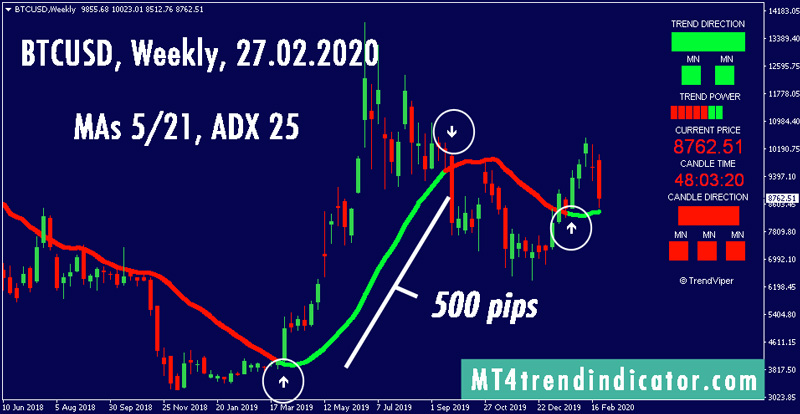
This is a Weekly chart and it represents over a year of Bitcoin price fluctuations.
The signal preceding the 500 pip move was generated in March 2019 when the price of Bitcoin was about $3900. Over a period of 6 months the price increased and a reversal signal was generated at around $8900.
This was a very substantial move that could have generated a nice profit.
If you would like to trade Bitcoin using your MetaTrader 4, the easiest option is to sign up with a broker that offers Bitcoin trading on MT4 accounts.
You can try the regulated EasyMarkets MT4 account, which also include a free practice account.